Is Josh Allen Vulturing James Cook?
The frustration is real: Josh Allen gets a wildly disproportionate share of Buffalo's rushing attempts near the goal line. But the numbers also explain why the Bills have little reason to stop giving him the ball.
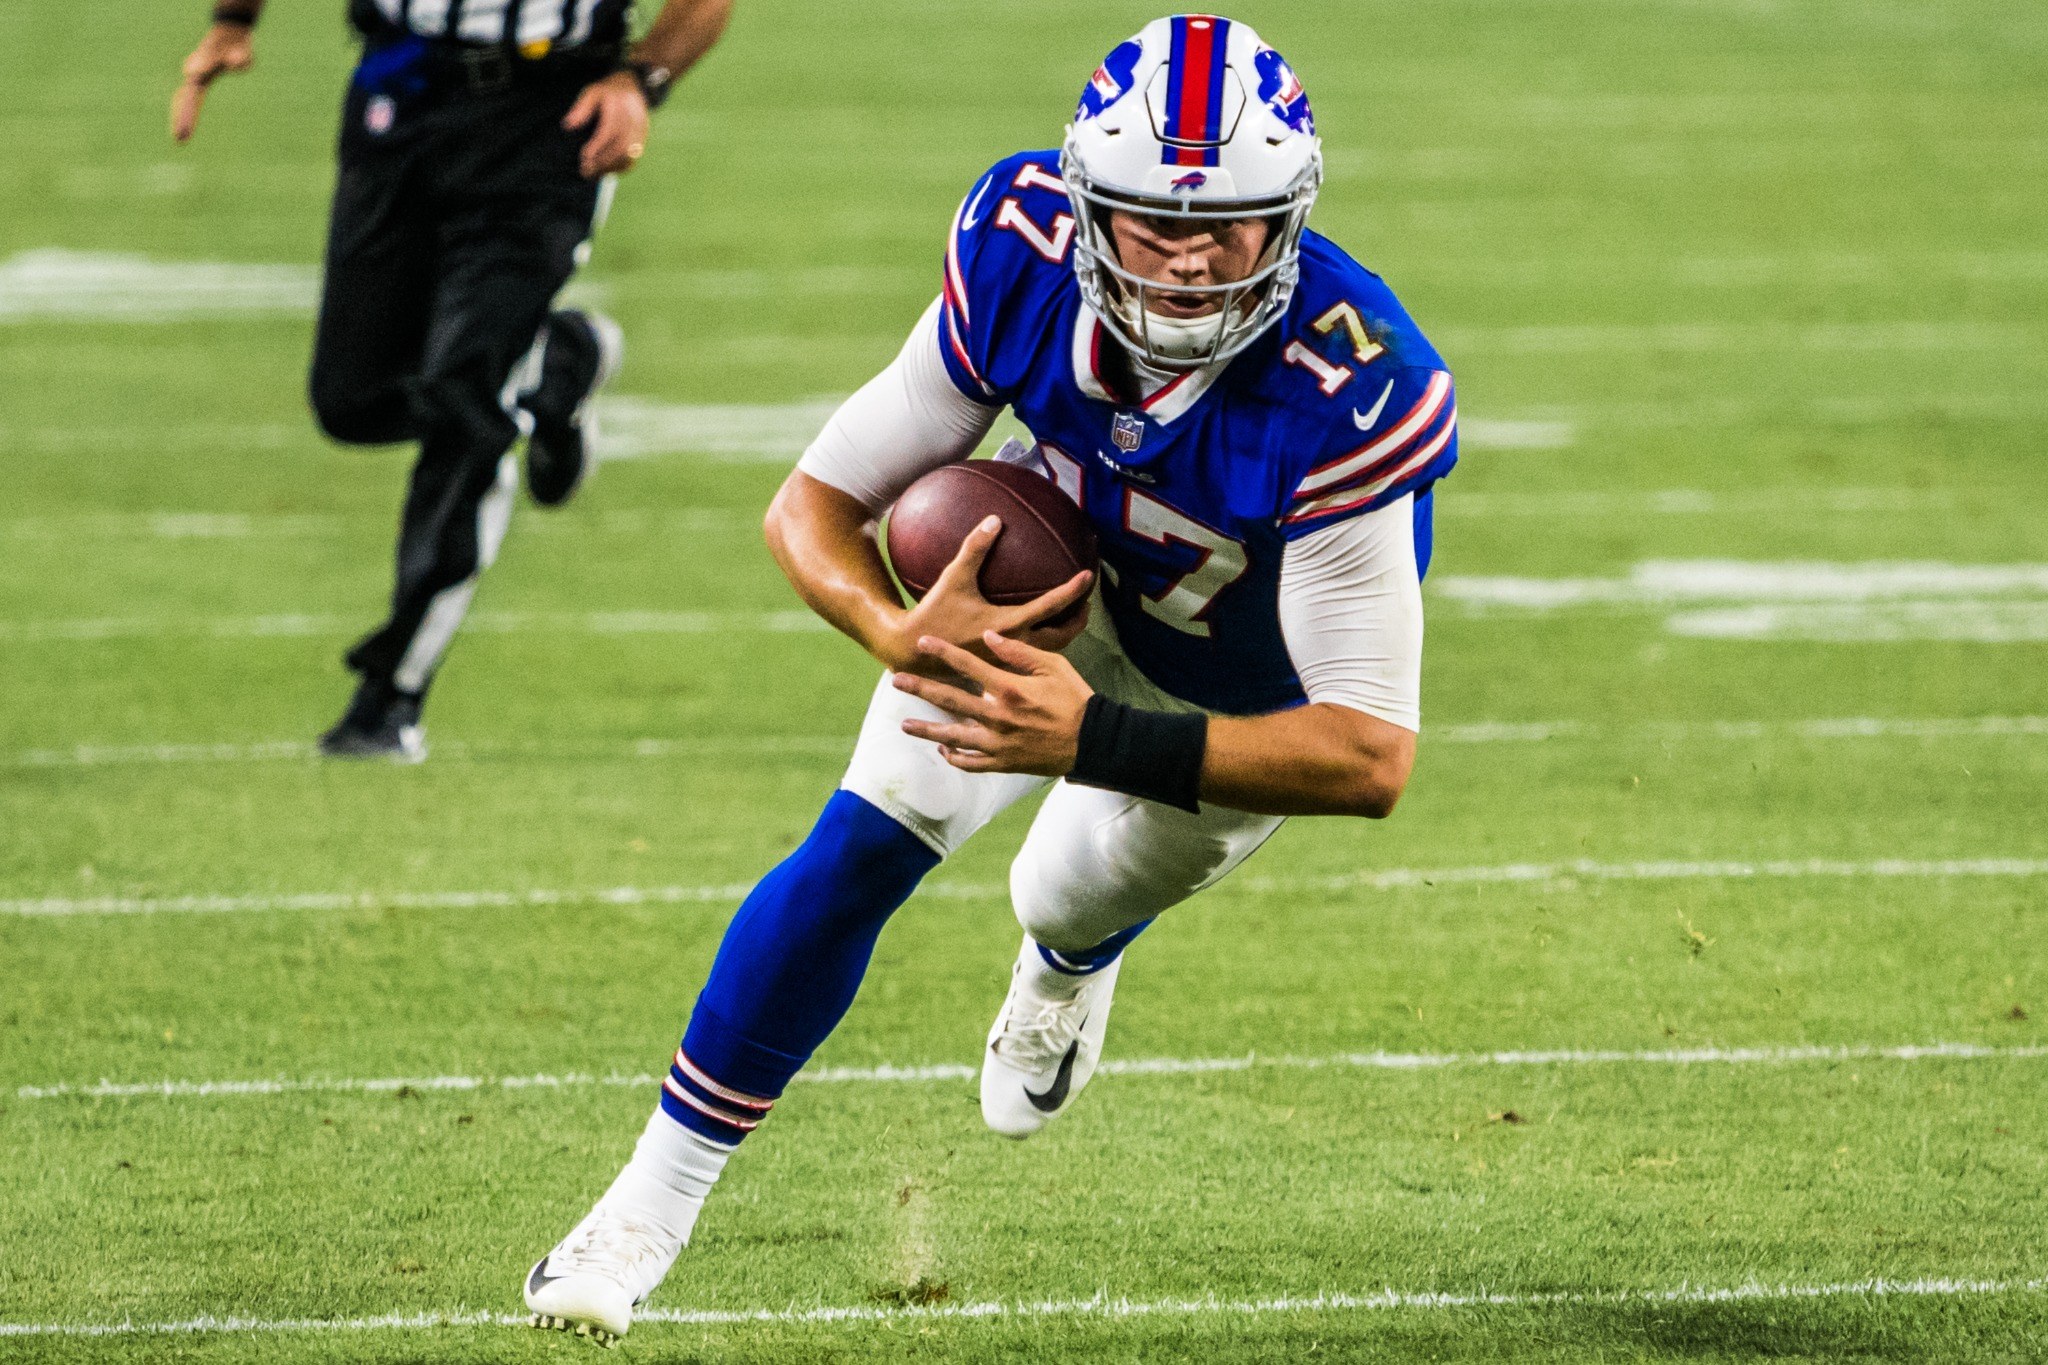
Yes, Allen takes an unusually large piece of Buffalo's goal-line rushing work.
Allen accounted for 39.5% of Buffalo's rushing attempts from inside the opponent's 5-yard line in 2025. Through two games in 2026, that share has climbed to 60.0%. But in 2025 Allen also converted those opportunities into touchdowns at nearly twice the rate of Buffalo's other runners.
Allen took 17 of Buffalo's 43 inside-the-5 rushes in 2025.
Fantasy managers watching James Cook lose a short-yardage touchdown opportunity to Allen aren't imagining the usage pattern. Buffalo used Allen as a runner on 17 of its 43 rushing attempts from the opponent's 5-yard line or closer last season.
Across the other 31 NFL teams in 2025, quarterbacks combined for 112 of 754 inside-the-5 rushing attempts — 14.9%. Allen's individual share of Buffalo's attempts was about 2.7 times that rate.
Allen was extreme. He wasn't even No. 1.
Justin Fields narrowly led the individual quarterback leaderboard in 2025, taking 41.7% of the Jets' inside-the-5 rushing attempts. Allen ranked second at 39.5%, followed by Jalen Hurts at 36.4%.
Sortable table: Click any column header to sort. “Share” is the individual quarterback's inside-the-5 rushes divided by all of his team's inside-the-5 rushing attempts.
| Rank | QB | Team | QB i5 Rushes | Team i5 Rushes | Share |
|---|---|---|---|---|---|
| 1 | J.Fields | NYJ | 5 | 12 | 41.7% |
| 2 | J.Allen | BUF | 17 | 43 | 39.5% |
| 3 | J.Hurts | PHI | 12 | 33 | 36.4% |
| 4 | T.Lawrence | JAX | 11 | 34 | 32.4% |
| 5 | T.Shough | NO | 5 | 16 | 31.2% |
| 6 | J.Dart | NYG | 7 | 31 | 22.6% |
| 7 | J.Herbert | LAC | 4 | 21 | 19.0% |
| 8 | T.Hill | NO | 3 | 16 | 18.8% |
| 9 | D.Jones | IND | 6 | 36 | 16.7% |
| 10 | G.Smith | LV | 2 | 13 | 15.4% |
| 11 | J.Brissett | ARI | 3 | 20 | 15.0% |
| 12 | B.Young | CAR | 2 | 14 | 14.3% |
| 13 | D.Maye | NE | 4 | 29 | 13.8% |
| 14 | D.Prescott | DAL | 4 | 30 | 13.3% |
| 15 | P.Mahomes | KC | 2 | 21 | 9.5% |
| 16 | C.Ward | TEN | 1 | 11 | 9.1% |
| 17 | M.Penix | ATL | 2 | 24 | 8.3% |
| 18 | J.Flacco | CLE | 2 | 24 | 8.3% |
| 19 | M.Mariota | WAS | 3 | 37 | 8.1% |
| 20 | J.Daniels | WAS | 3 | 37 | 8.1% |
| 21 | D.Mills | HOU | 2 | 25 | 8.0% |
| 22 | C.Stroud | HOU | 2 | 25 | 8.0% |
| 23 | B.Purdy | SF | 2 | 26 | 7.7% |
| 24 | J.Love | GB | 2 | 27 | 7.4% |
| 25 | C.Williams | CHI | 2 | 28 | 7.1% |
| 26 | A.Rodgers | PIT | 2 | 29 | 6.9% |
| 27 | J.McCarthy | MIN | 1 | 15 | 6.7% |
| 28 | S.Rattler | NO | 1 | 16 | 6.2% |
| 29 | K.Murray | ARI | 1 | 20 | 5.0% |
| 30 | J.Flacco | CIN | 1 | 20 | 5.0% |
| 31 | J.Browning | CIN | 1 | 20 | 5.0% |
| 32 | J.Burrow | CIN | 1 | 20 | 5.0% |
| 33 | B.Nix | DEN | 1 | 21 | 4.8% |
| 34 | B.Mayfield | TB | 1 | 22 | 4.5% |
| 35 | K.Cousins | ATL | 1 | 24 | 4.2% |
| 36 | S.Sanders | CLE | 1 | 24 | 4.2% |
| 37 | M.Jones | SF | 1 | 26 | 3.8% |
| 38 | M.Willis | GB | 1 | 27 | 3.7% |
| 39 | J.Milton | DAL | 1 | 30 | 3.3% |
| 40 | R.Wilson | NYG | 1 | 31 | 3.2% |
| 41 | J.Winston | NYG | 1 | 31 | 3.2% |
| 42 | L.Jackson | BAL | 1 | 32 | 3.1% |
| 43 | M.Stafford | LA | 1 | 32 | 3.1% |
| 44 | R.Leonard | IND | 1 | 36 | 2.8% |
| 45 | J.Johnson | WAS | 1 | 37 | 2.7% |
Allen wasn't just taking the carries. He was converting them.
This is where the football case for Buffalo's usage gets much stronger. Allen scored 11 touchdowns on his 17 inside-the-5 rushing attempts in 2025, a 64.7% conversion rate.
Every other Buffalo runner combined scored nine touchdowns on 26 attempts — 34.6%. Allen's conversion rate was 30.1 percentage points higher and about 1.87 times the rate of Buffalo's non-Allen runners.
| Runner Group | i5 Rushes | Rush TD | TD Rate |
|---|---|---|---|
| Josh Allen | 17 | 11 | 64.7% |
| All Other Buffalo Runners | 26 | 9 | 34.6% |
| Buffalo Overall | 43 | 20 | 46.5% |
Allen converted nearly two-thirds of his inside-the-5 rushing opportunities into touchdowns in 2025. This analysis is descriptive — it doesn't prove Allen caused Buffalo's overall efficiency — but it does show the Bills were getting strong results from the usage fantasy managers dislike.
Buffalo ranked No. 6 in inside-the-5 rushing TD rate.
Regardless of who carried the ball, Buffalo scored 20 rushing touchdowns on 43 attempts from inside the 5 in 2025. That's a 46.5% rushing touchdown rate, sixth-highest in the NFL.
That doesn't establish that Allen's workload caused Buffalo to rank sixth. It does establish something simpler: the Bills paired unusually heavy quarterback goal-line usage with one of the league's more efficient inside-the-5 rushing attacks.
| Rank | Team | i5 Rush TD | i5 Rushes | TD Rate |
|---|---|---|---|---|
| 1 | MIN | 9 | 15 | 60.0% |
| 2 | CAR | 8 | 14 | 57.1% |
| 3 | KC | 10 | 21 | 47.6% |
| 4 | IND | 17 | 36 | 47.2% |
| 5 | DAL | 14 | 30 | 46.7% |
| 6 | BUF | 20 | 43 | 46.5% |
| 7 | SEA | 13 | 28 | 46.4% |
| 8 | SF | 12 | 26 | 46.2% |
| 9 | ATL | 10 | 24 | 41.7% |
| 10 | NYJ | 5 | 12 | 41.7% |
| 11 | CIN | 8 | 20 | 40.0% |
| 12 | NYG | 12 | 31 | 38.7% |
| 13 | DEN | 8 | 21 | 38.1% |
| 14 | LAC | 8 | 21 | 38.1% |
| 15 | PIT | 11 | 29 | 37.9% |
| 16 | LA | 12 | 32 | 37.5% |
| 17 | GB | 10 | 27 | 37.0% |
| 18 | TB | 8 | 22 | 36.4% |
| 19 | TEN | 4 | 11 | 36.4% |
| 20 | CHI | 10 | 28 | 35.7% |
| 21 | JAX | 12 | 34 | 35.3% |
| 22 | ARI | 7 | 20 | 35.0% |
| 23 | NE | 10 | 29 | 34.5% |
| 24 | BAL | 11 | 32 | 34.4% |
| 25 | DET | 9 | 27 | 33.3% |
| 26 | WAS | 12 | 37 | 32.4% |
| 27 | MIA | 5 | 16 | 31.2% |
| 28 | CLE | 7 | 24 | 29.2% |
| 29 | NO | 4 | 16 | 25.0% |
| 30 | PHI | 8 | 33 | 24.2% |
| 31 | LV | 3 | 13 | 23.1% |
| 32 | HOU | 4 | 25 | 16.0% |
The early-season share is even larger.
Through Buffalo's first two games of 2026, the team has recorded five rushing attempts from inside the opponent's 5. Allen has three of them: 60.0%.
Five team attempts is far too small a sample to treat 60% as a stable 2026 rate. But it matters in one way: the usage that frustrated Cook managers in 2025 has not disappeared to begin 2026.
Cook managers have a legitimate complaint. Buffalo has a legitimate reason to ignore it.
Allen's goal-line rushing role is not normal quarterback usage. In 2025, he took 39.5% of Buffalo's inside-the-5 rushing attempts compared with a 14.9% quarterback rate across the other 31 teams. Only Fields had a larger individual share of his team's opportunities.
But Allen turned 11 of those 17 attempts into touchdowns. Buffalo's other runners converted nine of 26, and the Bills as a team finished sixth in the NFL in inside-the-5 rushing TD rate.
Yes, Josh Allen is taking goal-line carries. And yes, they're working.
That's the uncomfortable answer for James Cook fantasy managers: the usage is unusually quarterback-heavy, but Buffalo's results give the offense little statistical reason to abandon it.
Explore more player rushing data in the EdgeLine Rushing Stats database.
How we measured goal-line rushing share.
EdgeLine used nflverse regular-season play-by-play. An inside-the-5 rushing attempt is a recorded rushing attempt from the opponent's 5-yard line or closer. Nullified plays and quarterback kneel-downs were excluded. Scrambles, sneaks and designed quarterback runs were included because they are recorded rushing attempts.
Quarterbacks were identified using nflverse roster positions. Individual quarterback share equals that quarterback's valid inside-the-5 rushing attempts divided by all valid inside-the-5 rushing attempts by his team.
2026 scope: Through Week 2.
Buffalo comparison: Josh Allen's 17 inside-the-5 attempts versus the 26 attempts by all other Buffalo runners in 2025.
Important limitation: Conversion rate is descriptive. It does not isolate play design, defensive front, down, distance, blocking, runner choice or other contextual factors that can affect touchdown probability.