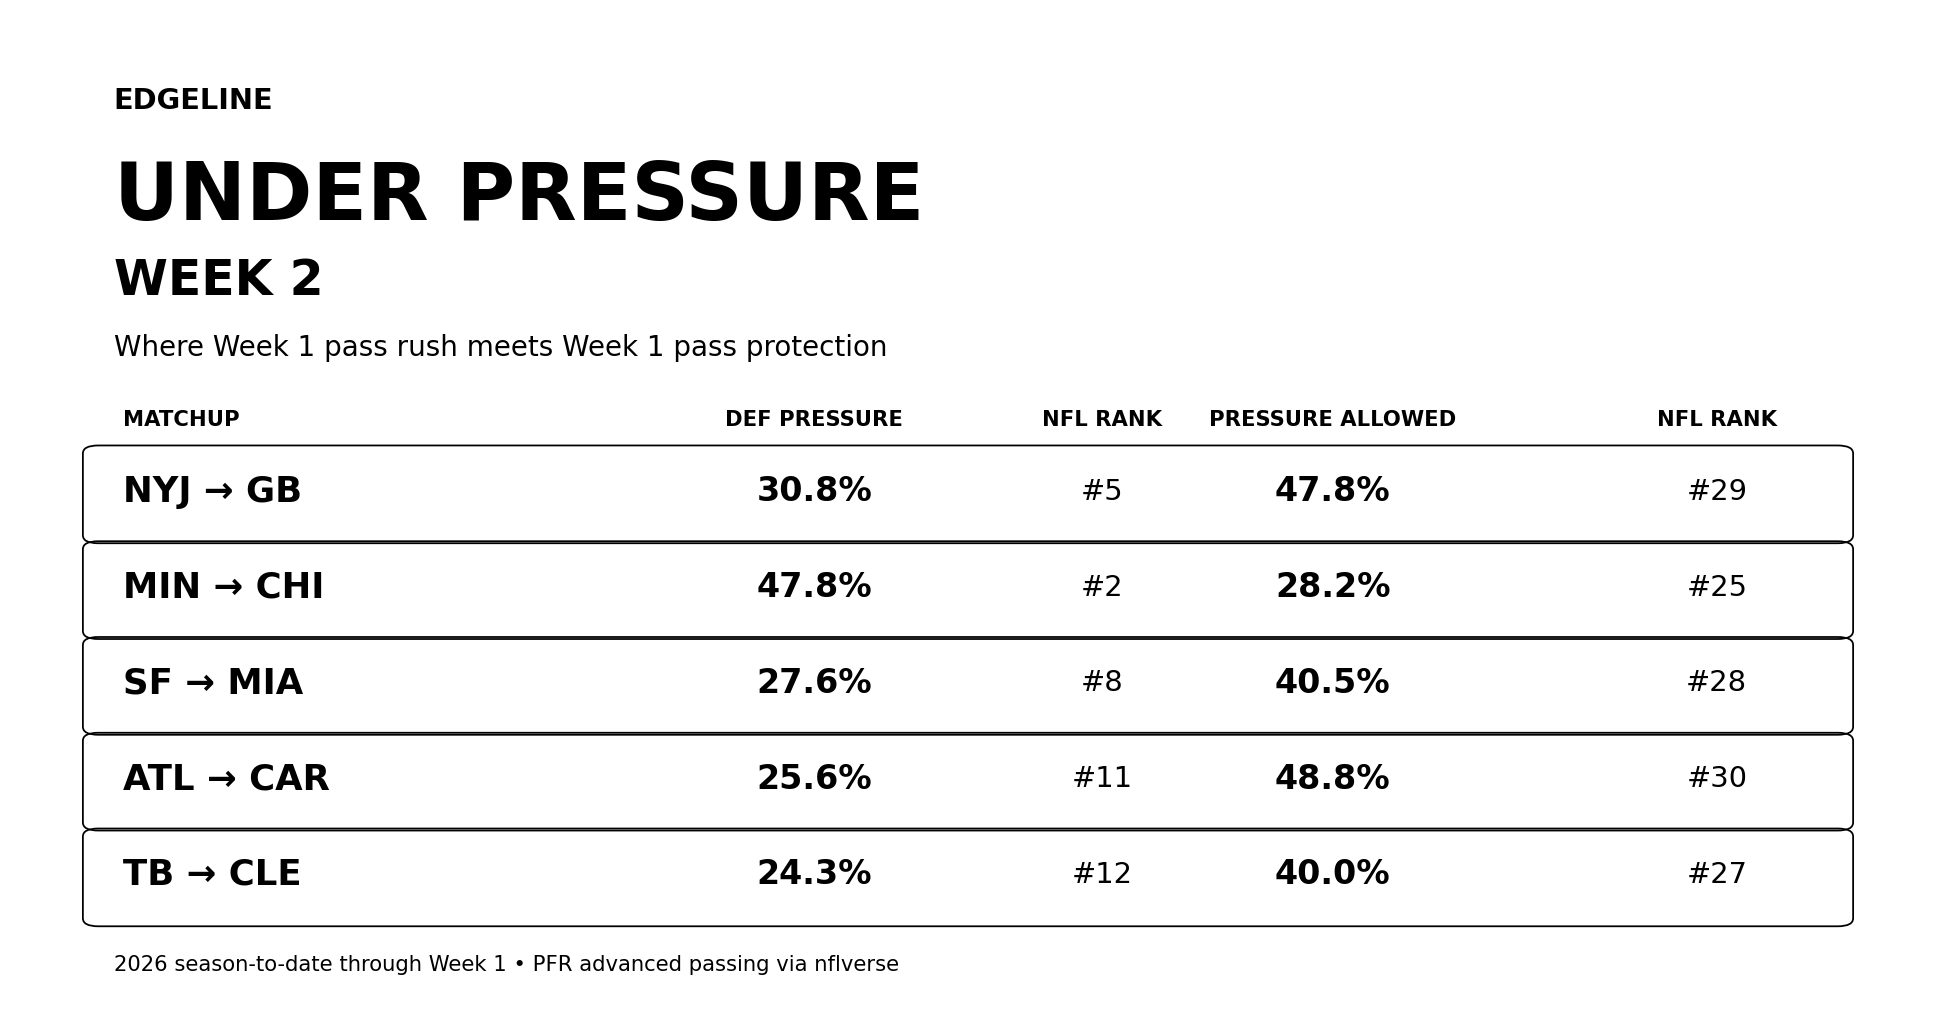
Pressure is only half of a matchup. A defense can create disruption, but the fantasy and football impact changes depending on how well the opposing offense keeps its quarterback clean. Under Pressure pairs each Week 2 defense's Week 1 pressure rate with the pressure rate allowed by the offense it faces next.
The clearest early collisions include the Jets' pass rush against Green Bay's protection, Minnesota against Chicago, San Francisco against Miami, Atlanta against Carolina and Tampa Bay against Cleveland. These are not projections; they are matchup flags built from what each side put on tape in Week 1.
Matchups That Stand Out
Strong pressure production meeting vulnerable protection
NYJ → GBNYJ: 30.8% pressure rate (#5)GB: 47.8% allowed (protection rank #29)
MIN → CHIMIN: 47.8% pressure rate (#2)CHI: 28.2% allowed (protection rank #25)
SF → MIASF: 27.6% pressure rate (#8)MIA: 40.5% allowed (protection rank #28)
ATL → CARATL: 25.6% pressure rate (#11)CAR: 48.8% allowed (protection rank #30)
TB → CLETB: 24.3% pressure rate (#12)CLE: 40.0% allowed (protection rank #27)
Week 2 Pressure Matchups
Defense pressure generated vs. opponent pressure allowed • 2026 through Week 1
| Defense → Offense | Pressure Generated | Pressure Allowed | Pressures | Sacks |
|---|---|---|---|---|
| NYJ → GBGB @ NYJ | 30.8%#5 | 47.8%#29 | 12 | 3 |
| MIN → CHIMIN @ CHI | 47.8%#2 | 28.2%#25 | 22 | 4 |
| SF → MIAMIA @ SF | 27.6%#8 | 40.5%#28 | 8 | 0 |
| ATL → CARCAR @ ATL | 25.6%#11 | 48.8%#30 | 11 | 2 |
| TB → CLECLE @ TB | 24.3%#12 | 40.0%#27 | 9 | 1 |
| CIN → HOUCIN @ HOU | 27.8%#7 | 26.2%#21 | 10 | 4 |
| CHI → MINMIN @ CHI | 48.8%#1 | 20.0%#12 | 20 | 2 |
| LV → LACLV @ LAC | 40.5%#3 | 20.0%#11 | 15 | 5 |
| BAL → NONO @ BAL | 26.5%#9 | 22.2%#17 | 9 | 2 |
| CLE → TBCLE @ TB | 20.8%#18 | 27.8%#24 | 5 | 1 |
| BUF → DETDET @ BUF | 26.2%#10 | 22.0%#15 | 11 | 3 |
| NE → PITPIT @ NE | 22.2%#15 | 25.6%#20 | 6 | 2 |
| CAR → ATLCAR @ ATL | 28.2%#6 | 19.2%#10 | 11 | 2 |
| PHI → TENPHI @ TEN | 18.4%#23 | 30.8%#26 | 7 | 1 |
| ARI → SEASEA @ ARI | 20.0%#20 | 22.2%#16 | 7 | 3 |
| SEA → ARISEA @ ARI | 19.0%#22 | 23.1%#18 | 8 | 3 |
| NYG → LARNYG @ LAR | 11.1%#28 | 27.6%#23 | 4 | 0 |
| HOU → CINCIN @ HOU | 15.6%#25 | 24.3%#19 | 5 | 2 |
| DET → BUFDET @ BUF | 22.2%#14 | 15.6%#6 | 14 | 5 |
| LAC → LVLV @ LAC | 23.1%#13 | 12.9%#4 | 9 | 1 |
| NO → BALNO @ BAL | 22.0%#16 | 16.7%#7 | 9 | 1 |
| PIT → NEPIT @ NE | 19.2%#21 | 19.0%#9 | 5 | 4 |
| WAS → DALWAS @ DAL | 21.9%#17 | 11.1%#3 | 7 | 3 |
| TEN → PHIPHI @ TEN | 3.8%#30 | 21.9%#14 | 1 | 0 |
| GB → NYJGB @ NYJ | 20.0%#19 | 3.8%#1 | 6 | 3 |
| DAL → WASWAS @ DAL | 15.2%#26 | 18.4%#8 | 5 | 2 |
| LAR → NYGNYG @ LAR | 8.3%#29 | 15.2%#5 | 3 | 0 |
| MIA → SFMIA @ SF | 12.9%#27 | 8.3%#2 | 4 | 0 |
| JAX → DENJAX @ DEN | 40.0%#4 | Pending— | 12 | 5 |
| IND → KCIND @ KC | 16.7%#24 | Pending— | 5 | 2 |
| KC → INDIND @ KC | Pending— | 26.5%#22 | — | — |
| DEN → JAXJAX @ DEN | Pending— | 20.8%#13 | — | — |
Methodology: Pressure data comes from Pro Football Reference advanced passing statistics distributed through nflverse. Defensive pressure rate is the pressure recorded against the defense's opposing quarterbacks; offensive pressure allowed is the pressure recorded against that offense's quarterbacks. Rankings are season-to-date through completed games prior to Week 2. The article does not use a proprietary matchup score. Missing source data is marked Pending rather than estimated. DEN → JAX remains pending in the current source feed.